Showing posts with label GISTemp. Show all posts

Saturday, March 12, 2016

Lucia's sadly selective statistical showpersonship

Lucia Liljegren is spending the twilight of lukewarmism as a non-laughable position mostly posting recipes, and notifying her followers about the arrival of major holidays (three of her last ten posts.) But 'twas not always thus. During the "hiatus" Lucia was fond of comparing the IPCC's multi-modal mean with global temperatures, despite the fact that these were models of climate, not weather forecasts, and that patient people had explained to her over and over that "about 0.2C/decade over the next several decades" was not a prediction one could falsify based on a few years of data.

She liked making this mistake so much, she did it again and again and again (and again and again…and again.) But this all stopped rather abruptly in November of 2014, which funnily enough was exactly the time El Nino came to a stuttering start after a unprecedented 50-month absence:


As a result, every month after November 2014 (anomaly 0.68C) has been hotter (anomaly-wise) than November 2014 itself:

And yet despite the rather dramatic turn in the data, and despite the fact that she liked making this comparison well enough to make it over and over again with different temperature records and updates to the present, she never updated her final graph, which looked like this:


Why did Dr Liljegren suddenly lose interest in this exercise? Why the statistical-torture hiatus? We may never know, but said graph with more recent GISTEMP measurements superimposed looks like this:


It's a mystery, really.

UPDATE: MartinM has better graph-fu than I and has updated lucia's graph of the multi-model mean vs the 13-month mean.


Saturday, August 15, 2015

GISTEMP: +0.75C, Hottest July in the record

GIStemp has updated and the +0.75C anomaly makes July 2015 the hottest July in the instrumental record, setting another 12-month running average record and increasing the likelihood 2015 will break the record set in 2014(!).

Somebody tell me, I'm just a poor amateur -- are the records in a 135-year-old dataset supposed to come one right after another like that? Seems . . . concerning.

Friday, July 17, 2015

GISTEMP: June 2015 tied for hottest ever

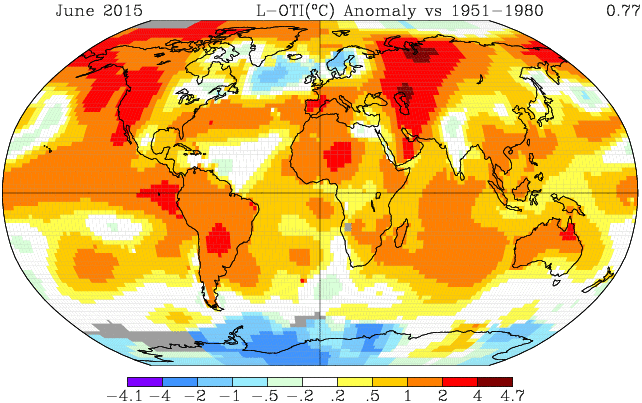
GISTEMP has finally updated, and it's a doozy: June clocked in at +0.76 C, tied with June 1998 as the hottest June in the surface record.

This also makes this the hottest Jan-June on record. With 2015 clocking in at +0.805 C, only 2010 comes close at +0.795 C.

UPDATE: Just when I thought I was done correcting this post, GISTEMP has updated its numbers again, rendering all the numbers in the post just a little bit wrong. Here's the new map:

 June 2015 now comes in at +0.80 C, and June 1998 is a little warmer as well, +0.77 C. That makes June 2015 the warmest June in the GISTEMP records.

Wednesday, April 15, 2015

GISTEMP March: +0.84C


GISTEMP updated pretty early this month, it seems. March was very hot; 3rd hottest on record (+0.84C). That should mean another "hottest 12 months" is in the offing.

Friday, January 16, 2015

GISTEMP is in: 2014 is the hottest year; there's still a tiger in your bedroom

Anomaly +0.68C. 2014 edged out 2010 at +0.66C.

Warming continues to be closely in line with the trend since 1970:

Many people have tried to explain this to climate deniers, who chose not to understand it (1). If anyone else is confused by it, this is the bottom line: you need to apply the same standard of proof to a hypothetical change in the warming trend as you would to determining the existence of a trend in the first place.

Having determined that there has been a warming trend of about 0.16C/decade for the 30 years between 1970 and 2000, the correct question is not has the warming stopped OMG (a question you will never be able to answer with a few years of data) but rather is there any reason to think the trend is different from what it was before?

If you determine there's a tiger in your bedroom, and then (wisely) don't go into your bedroom for a while, the test for whether there's still a tiger there in not whether you've heard it roar in the last 5 minutes. Unless you have convincing evidence, you probably should conclude that the tiger's still there, until and unless you get some strong evidence something has changed.

-------
1. 
So, what is wrong with Cruz’s statement?  Well, assuming that by ‘recorded warming’, he means the satellite-derived lower atmospheric surface temperatures his statement is absolutely correct.  If he is referring to globally averaged surface temperatures since 2000, there is only a very small amount of warming; this small amount of warming is indeed contrary to the theory of AGW.
Who? Who else?

Wednesday, June 11, 2014

GISTEMP redux: (Still) 2nd warmest April in the temperature record

+.73C, an increase of .03C compared to March and the hottest April ever, bar 2010 (as an aside, the first half of 2010 was a scorcher.)

How hot is that? Well, prior to 1970, the hottest April since records begin was in May 1969, +0.15C. The people alive in 1970 had never seen a April within half a degree of what we just saw. Given the inherent variability of monthly temperatures, that's pretty amazing.

Monday, September 12, 2011

GISS: +0.61C, 4th warmest August on record


From the third warmest July (+0.59C) to the fourth warmest August, the persistence of Nina-ish conditions does not seem to be helping cool this torrid summer. (H/t to the sharp eyes of Quark Soup.)

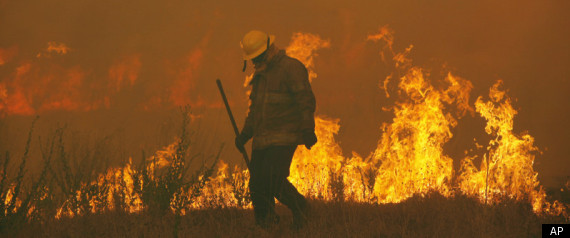
Have a kind thought for fire fighters in Texas, coping with the worst of all possible worlds: record heat (thanks to global warming), record drought (thanks to La Nina and, again, global warming), and vicious cuts to fire services that have left firefighters ponying up for their own gear (thanks to a jackass climate denier governor whose prayers for rain have gone unanswered -- apparently Perry is not familiar with the old saw that God helps those that help themselves.)