
Curt Stager has some reassurance for us regarding Greenland's ice sheet:
Another way to estimate the durability of Greenland's ice is to look to the distant past. Ice cores and marine sediments show that dozens of cyclic natural warmings have punctuated the last 2 to 3 million years without totally deglaciating the poles. The one before the last ice age, the Eemian Interglacial, kept Arctic summers several degrees warmer than now between 130,000 and 117,000 years ago, but at least half of Greenland remained glaciated even after 13,000 years of Eemian heating.Oh, good. As long as it doesn't get any warmer than it was in the Eemian, we shouldn't lose more than half of the Greenland ice sheet. But of course, if you lose ice from Greenland you will probably lose ice from elsewhere, too, so we should probably look at what sea levels did in the Eemian, rather than just one source of what. They were about 13 to 20 feet higher than today.
Now one might object that Stager says this took place over 13,000 years. But that's not exactly what he said. He said that after 13,000 years, about half the ice was gone. That's not quite the same thing. Glaciers persist because of a balance of accumulation of new ice and melt. A given amount of warming pushes the equilibrium of the glacier towards a reduced size, but unless the reduced size starts to compromise the accumulation zone, the new equilibrium can be stable. Meaning that Greenland could have lost all that ice in a couple of centuries following the warming, and then remained in a stable half-melted state for the next 12,800 years. We don't know. Our proxies are not detailed enough to tell us. We know half the ice was there after twelve thousand years, but we don't know if that represents a rapid melt and a new equilibrium, or a gradual 13,000-years melting.
But, still. Twenty feet. We can do twenty feet, surely? I see the Bangladeshi delegation have their hands up. Please hold your questions until the end. Thank you.
The trouble with the reassuring anecdote of the Eemian is that it was not really all that much warmer than the present. Some parts of Europe were 1-2C cooler than today. The Arctic may have been "several degrees" warmer -- due to Arctic amplification, which we already observe with regards to the present warming.
 |
| SRES A1B, warming per century, from Real Climate |
So what were the sea levels like the last time the world was +4C warmer (+8C at the poles) (the warming expected over the next century or so)?
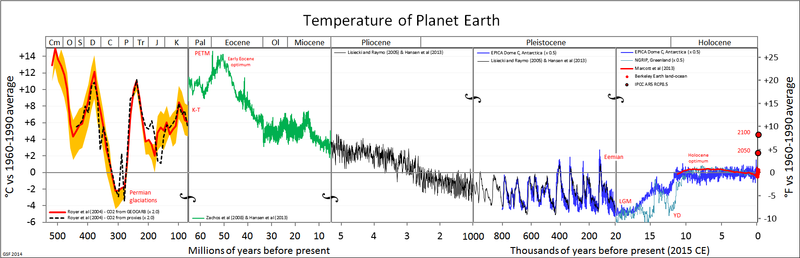
If you look at the +2C line (which is probably the best case scenario for 2100, with aggressive mitigation; we are +0.8C now) you'll see the world has not seen temperatures that warm in the last ten million years, including the Eemian. The last time we were at +4C was in the Eocene, some 40 million years ago. What were the sea levels then? That turns out to be a tricky question to answer precisely, because over tens of millions of years, the land as well as the seas are moving up and down. But there was little ice in Antarctica, or in Greenland. Which, if it happened today, would equate to a 80 meter sea level rise -- 260 feet.
This is what the United States looks like after an 80 meter rise:

The Eastern seaboard is gone.

The Gulf is gone.

The principle cities of the West Coast are gone.


I don't know how long we would have to remain at +4C for this to happen. A very long time, I fervently hope. But if you are looking for analogies to the coming warming, mine seems closer to the coming centuries than his. Yet he's a note paleoclimatologist with a book out on this very subject:
So why what seems to be a falsely reassuring analogy? Perhaps I'm missing something basic. He's the climate scientist, not me. To my layman's understanding, he seems to be avoiding the uneasy truth of just how far out of the realm of anything we know we are pushing the world's climate. He's striving to sound reasonable, but the threat is objectively so much bigger than the discourse is prepared to accept, that to sound reasonable you have to downplay the logical implications of the paleoclimate record.
Not sure what, but there's something wrong with the temps in that graphic. E.g., global temps in the mid-Pliocene ~3.3.mya were 2-3C above present.
ReplyDeleteFor scary scientist quotes, the folks studying the PETM are better. There are several in this current NatGeo article, including this from Matt Huber:
"We've basically been trying to edit ourselves. Whenever we see something really bad, we tend to hold off. The middle ground is actually much worse than people think. If we continue down this road, there really is no uncertainty. We're headed for the Eocene. And we know what that's like."
But even re the Eemian, Jim Hansen sees evidence of abrupt SLR consistent with your take.
"In other words, the end of the next century will be warmer than the Eemian was. "
ReplyDeleteshould probably read '...this century...'
I checked around the literature a little more and present thinking seems to be that the warm mid-Miocene was about 4-6C more than current with CO2 maxing out at about 450-550 ppm, which is of course a range that's probably no longer avoidable.
ReplyDeleteAFAICT the proxy stack (note not a tempeature recon) used for the third panel in the graphic remains canonical and IIRC ocean temperature should track it fairly well, but the splice and the relationship to the temp scale are arbitrary.
so the +2C might well mean an equilibrium MSL of late-Miocene levels whatever they were? And that BAU could well make the earth to go Ts and MSLs of mid-Miocene? Oops.
ReplyDeleteThe +2C is a low-end figure for the mid-Pliocene and implies ~25 meters SLR. IIRC the late Miocene was warmer than that on average, although a little less so than the mid-Miocene.
ReplyDeletejyyh, this paper will be of interest to you. It's a correlation of CO2 with polar ice changes (=> sea level), which is actually a lot more informative than correlating the former with temperature.
ReplyDeleteNote in particular that the prior work on trying to figure out how the Antarctic ice sheet behaves as CO2 changes (ref. 35) had CO2 at much, much higher levels to have a major impact on Antarctica, so this paper (based on a new proxy technique) was considered pretty radical when it first came out. After two years, though, it still looks good.
thanks Steve Bloom, but it seems i have to cheer myself up somwhat before tackling that one. Got my copy of that, though.
ReplyDelete