Showing posts with label arctic. Show all posts

Sunday, September 9, 2012

Bottom line: Does switching from coal to shale gas slow climate change?

Keith Kloor "asks" Will Fracking Help Or Hinder the Fight Against Climate Change? Unfortunately, it soon becomes clear that he has little interest in trying to answer that question, and instead uses it as an excuse to beat up on his favorite villains, those crazy environmentalists:
Gas emits much less carbon than coal (probably between 25% and 50% less), which is a net plus on the global warming ledger. And shale gas, in case you hadn’t heard, is entering a golden age; it is abundant and newly retrievable across the world, not just in the United States. It’s the bridge fuel to a clean energy future that liberal think tanks and university researchers were touting just a few years ago. Given the political stalemate on climate change, one energy expert gushed in a recent NYT op-ed: “Shale gas to the rescue.”


But a grassroots backlash to the relatively new technology (hydraulic fracturing) that unlocks shale gas has set in motion powerful forces opposed to this bridge getting built. Leading climate campaigners, citing concerns about industry practices and continued reliance on fossil fuels (even if less carbon intensive), are now a big part of the growing anti-fracking coalition. Mainstream environmentalists have also jumped on that bandwagon.
Thus the battle lines are drawn, with enviros and climate activists digging in their heels against a shale gas revolution that could pay big climate dividends.
Lest you think I'm quoting Kloor's conclusions following a careful analysis of the pros and cons of shale gas, the above is from the third, fourth, and fifth paragraphs of Kloor's essay. Really. So the title of the essay is really quite misleading. Kloor spends not a bit of virtual ink on whether fracking will "help or hinder the fight against climate change." Instead he blandly proclaims it "the bridge fuel to the clean energy future" and directs the remainder of his energies to the question of whether "enviros and climate activists" will help or hinder it.

It's a shame, and not just because it is rehash of an essay Kloor has written approximately five hundred times (Enviros crazy! Me sane and moderate!) dressed up as something new. It is a shame because the question itself is very interesting and important: is shale gas a good thing from the perspective of global warming, or not?

There are three major factors to examine in considering the relative impact of shale gas and coal on climate change:

1. CO2 produced per unit of energy.
2. Methane produced per unit of energy (conventionally referred to, with gas, as the methane leakage rate).
3. Aerosol cooling (coal more than gas, by far.)

Non-AGW factors will be left out of the equation for now. These include water pollution, direct harm from inhalation (asthma, COPD, lung cancer), and damage to the landscape. These are not unimportant, but they complicate an analysis that is already quite complicated. So we will stick with the effects on global warming.

Looking at the three factors above, we can see that the long-term factor (CO2) favors gas, while the short-term factors (methane and aerosols with their short half-lives in the atmosphere) favor coal. So we would expect, intuitively, that shale gas would do well in the long term, and less well in the short term. And this is exactly what the literature shows.

Source.
Looking at Hultman et al (2011) (4th abstract below) we see that methane leakage make shale gas worse than coal in the short term (20 years) about the same in the medium term (100 years) and better in the long term (500 years). Hultman et al does not consider the negative aerosol forcing associated with burning coal, so gas is relatively advantaged in these calculations.

When aerosols are included in the calculations, the break-even point for shale gas is even further in the future.

Here are a few of the recent papers examining this question:


We evaluate the greenhouse gas footprint of natural gas obtained by high-volume hydraulic fracturing from shale formations, focusing on methane emissions. Natural gas is composed largely of methane, and 3.6% to 7.9% of the methane from shale-gas production escapes to the atmosphere in venting and leaks over the life-time of a well. These methane emissions are at least 30% more than and perhaps more than twice as great as those from conventional gas. The higher emissions from shale gas occur at the time wells are hydraulically fractured—as methane escapes from flow-back return fluids—and during drill out following the fracturing. Methane is a powerful greenhouse gas, with a global warming potential that is far greater than that of carbon dioxide, particularly over the time horizon of the first few decades following emission. Methane contributes substantially to the greenhouse gas footprint of shale gas on shorter time scales, dominating it on a 20-year time horizon. The footprint for shale gas is greater than that for conventional gas or oil when viewed on any time horizon, but particularly so over 20 years. Compared to coal, the footprint of shale gas is at least 20% greater and perhaps more than twice as great on the 20-year horizon and is comparable when compared over 100 years. [Howarth et al became the focus of a debate between the authors and another group of researchers championed by Anthony Revkin. Cathles et al substituted optimistic estimates of methane leakage for Howarth's pessimistic estimates (which led to a letter, which led to a press release), and ignored the 20-year horizon, arguing that only 100 years and longer are appropriate measures of climate impact. Ignoring the 20-year time horizon is a common tactic of shale gas boosters, as we see below. Cathles goes further by ignoring the difference in aerosol forcing between present-day coal and shale gas, reasoning that we'll have to get rid of dirty coal plants someday anyway!]

"Greater focus needed on methane leakage from natural gas infrastructure"

Natural gas is seen by many as the future of American energy: a fuel that can provide energy independence and reduce greenhouse gas emissions in the process. However, there has also been confusion about the climate implications of increased use of natural gas for electric power and transportation. We propose and illustrate the use of technology warming potentials as a robust and transparent way to compare the cumulative radiative forcing created by alternative technologies fueled by natural gas and oil or coal by using the best available estimates of greenhouse gas emissions from each fuel cycle (i.e., production, transportation and use). We find that a shift to compressed natural gas vehicles from gasoline or diesel vehicles leads to greater radiative forcing of the climate for 80 or 280 yr, respectively, before beginning to produce benefits. Compressed natural gas vehicles could produce climate benefits on all time frames if the well-to-wheels CH4 leakage were capped at a level 45–70% below current estimates. By contrast, using natural gas instead of coal for electric power plants can reduce radiative forcing immediately, and reducing CH4 losses from the production and transportation of natural gas would produce even greater benefits. There is a need for the natural gas industry and science community to help obtain better emissions data and for increased efforts to reduce methane leakage in order to minimize the climate footprint of natural gas. 


Recent reports show growing reserves of unconventional gas are available and that there is an appetite from policy makers, industry, and others to better understand the GHG impact of exploiting reserves such as shale gas. There is little publicly available data comparing unconventional and conventional gas production. Existing studies rely on national inventories, but it is not generally possible to separate emissions from unconventional and conventional sources within these totals. Even if unconventional and conventional sites had been listed separately, it would not be possible to eliminate site-specific factors to compare gas production methods on an equal footing. To address this difficulty, the emissions of gas production have instead been modeled. In this way, parameters common to both methods of production can be held constant, while allowing those parameters which differentiate unconventional gas and conventional gas production to vary. The results are placed into the context of power generation, to give a ″well-to-wire″ (WtW) intensity. It was estimated that shale gas typically has a WtW emissions intensity about 1.8–2.4% higher than conventional gas, arising mainly from higher methane releases in well completion. Even using extreme assumptions, it was found that WtW emissions from shale gas need be no more than 15% higher than conventional gas if flaring or recovery measures are used. In all cases considered, the WtW emissions of shale gas powergen are significantly lower than those of coal.[Note, however, that this paper, brought to you by "Shell Global Solutions," ignores the 20-year horizon completely: "Some authors have considered 20-year global warming potential
factors, but use of these is not widely accepted."]

"The greenhouse impact of unconventional gas for electricity generation" Nathan Hultman, Dylan Rebois, Michael Scholten and Christopher Ramig 2011 Environ. Res. Lett.

 New techniques to extract natural gas from unconventional resources have become economically competitive over the past several years, leading to a rapid and largely unanticipated expansion in natural gas production. The US Energy Information Administration projects that unconventional gas will supply nearly half of US gas production by 2035. In addition, by significantly expanding and diversifying the gas supply internationally, the exploitation of new unconventional gas resources has the potential to reshape energy policy at national and international levels—altering geopolitics and energy security, recasting the economics of energy technology investment decisions, and shifting trends in greenhouse gas (GHG) emissions. In anticipation of this expansion, one of the perceived core advantages of unconventional gas—its relatively moderate GHG impact compared to coal—has recently come under scrutiny. In this paper, we compare the GHG footprints of conventional natural gas, unconventional natural gas (i.e. shale gas that has been produced using the process of hydraulic fracturing, or 'fracking'), and coal in a transparent and consistent way, focusing primarily on the electricity generation sector. We show that for electricity generation the GHG impacts of shale gas are 11% higher than those of conventional gas, and only 56% that of coal for standard assumptions. [But see above.]
 Substitution of natural gas for coal is one means of reducing carbon dioxide (CO2) emissions. However, natural gas and coal use also results in emissions of other radiatively active substances including methane (CH4), sulfur dioxide (SO2), a sulfate aerosolprecursor, and black carbon (BC) particles. Will switching from coal to gas reduce the net impact of fossil fuel use on global climate? Using the electric utility sector as an example, changes in emissions of CO2, CH4,SO2 and BC resulting from the replacement of coal by natural gas are evaluated, and their modeled net effect on global mean-annual temperature calculated. Coal-to-gas substitution initially produces higher temperatures relative to continued coal use. This warming is due to reduced SO2 emissionsand possible increases in CH4 emissions, and can last from 1 to 30years, depending on the sulfur controls assumed. This is followed by a net decrease in temperature relative to continued coal use, resulting from lower emissions of CO2 and BC. The length of this period and the extent of the warming or cooling expected from coal-to-gas substitution is found to depend on key uncertainties and characteristics of the substitutions, especially those related to: (1) SO2 emissions and consequentsulphate aerosol forcing; and (2) the relative efficiencies of the power plantsinvolved in the switch. [Short-term: more warming with shale gas. Longer term: gas beats coal. The exact time horizons seem to be quite sensitive to the initial assumptions, but there seems to be fairly broad agreement about the overall picture, and dissenters -- like "Shell Global Solutions" -- get around these facts by simply ignoring the short-term time frame.]

Coal to gas: the influence of methane leakage
Tom M. L. Wigley

Carbon dioxide (CO2) emissions from fossil fuel combustion may be reduced by
using natural gas rather than coal to produce energy. Gas produces approximately half the amount of CO2 per unit of primary energy compared with coal. Here we consider a scenario where a fraction of coal usage is replaced by natural gas (i.e., methane, CH4) over a given time period, and where a percentage of the gas production is assumed to leak into the atmosphere. The additional CH4 from leakage adds to the radiative forcing of the climate system, offsetting the reduction in CO2 forcing that accompanies the transition from coal to gas. We also consider the effects of: methane leakage from coal mining; changes in radiative forcing due to changes in the emissions of sulfur dioxide and carbonaceous aerosols; and differences in the efficiency of electricity production between coal- and gas-fired power generation. On balance, these factors more than offset the reduction in warming due to reduced CO2 emissions. When gas replaces coal there is additional warming out to 2,050 with an assumed leakage rate of 0%, and out to 2,140 if the leakage rate is as high as 10%.
. . .
In our analyses, the temperature differences between the baseline and coal-to-gas
scenarios are small (less than 0.1°C) out to at least 2100. The most important result,
however, in accord with the above authors, is that, unless leakage rates for new
methane can be kept below 2%, substituting gas for coal is not an effective means for reducing the magnitude of future climate change.
This is contrary to claims such as that by Ridley (2011) who states (p. 5), with regard to the exploitation of shale gas, that it will “accelerate the decarbonisation of the world economy”. The key point here is that it is not decarbonisation per se that is the goal, but the attendant reduction of climate
change. Indeed, the shorter-term effects are in the opposite direction. Given the small
climate differences between the baseline and the coal-to-gas scenarios, decisions regarding further exploitation of gas reserves should be based on resource availability (both gas and water), the economics of extraction, and environmental impacts unrelated
to climate change.

----------------------------

So after this whirlwind tour of shale gas research, what do we know? There is no consensus about whether or not substituting shale gas for coal will slow global warming this century. This is not going to be one of those issues where all the science is lined up on one side, and all the partisan kooks are lined up on the other. The exact effect of switching from coal to shale gas depends upon a number of factors that are difficult to pin down, including:

1. The size of the aerosol forcing. After many decades of trying to pin it down, we still do not know exactly how much cooling the SO2 and other coal-burning byproducts are causing. Obviously the effects of switching from coal to gas depend on how much coal-burning byproducts temporarily cool the planet.

2. The amount of methane leakage. This is a function of not just how well we measure methane leakage, but whether we aggressively regulate methane leakage to hold it to an absolute minimum.

3. The discount rate. Not really a physical constant, but more of a philosophical question: how important is relative cooling 300 years from now compared to worsening global warming over the next twenty years (or fifty years, or hundred years)?

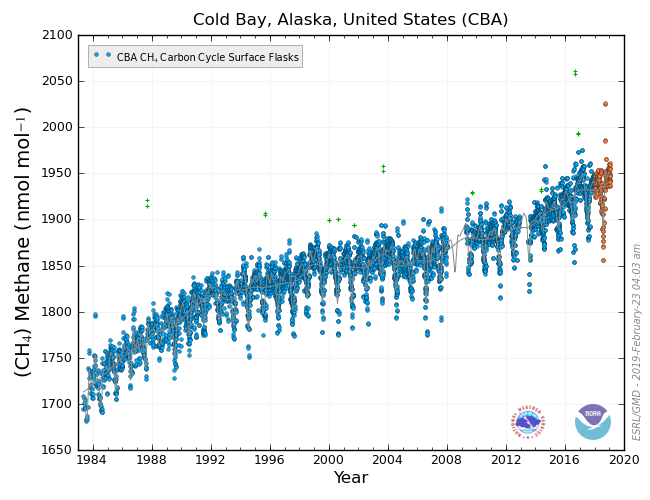
4. The half-life of methane in the atmosphere. As far as I know, no one has discussed this relative to the shale gas question, but the oxidization of methane to CO2 by free radicals is subject to saturation, which is the science-y way of saying that the more methane you put in the atmosphere, the longer each molecule stays in the atmosphere:

The magnitude and feedbacks of future methane release from the Arctic region are unknown. Despite limited documentation of potential future releases associated with thawing permafrost and degassing methane hydrates, the large potential for future methane releases calls for improved understanding of the interaction of a changing climate with processes in the Arctic and chemical feedbacks in the atmosphere. Here we apply a “state of the art” atmospheric chemistry transport model to show that large emissions of CH 4 would likely have an unexpectedly large impact on the chemical composition of the atmosphere and on radiative forcing (RF). The indirect contribution to RF of additional methane emission is particularly important. It is shown that if global methane emissions were to increase by factors of 2.5 and 5.2 above current emissions, the indirect contributions to RF would be about 250% and 400%, respectively, of the RF that can be attributed to directly emitted methane alone. Assuming several hypothetical scenarios of CH 4 release associated with permafrost thaw, shallow marine hydrate degassing, and submarine landslides, we find a strong positive feedback on RF through atmospheric chemistry. In particular, the impact of CH 4 is enhanced through increase of its lifetime, and of atmospheric abundances of ozone, stratospheric water vapor, and CO 2 as a result of atmospheric chemical processes. Despite uncertainties in emission scenarios, our results provide a better understanding of the feedbacks in the atmospheric chemistry that would amplify climate warming.
So depending on how widely shale gas is adopted, and on whether other sources of methane such as permafrost melting or methyl hydrates come into play, methane leaks from shale gas could have double or even quadruple the impact on the climate presently assumed.

Given these uncertainties, what can we say with at least moderate confidence?

1. Shale gas is probably worse than coal on the 20 year horizon. Apart from all the other evidence, the determination of shale gas boosters to avoid talking about the 20 year horizon suggests that this is the case.

2. There is a time horizon out there at which shale gas becomes better from a warming perspective than coal. It's just not clear yet whether it is at 25, 100, or 300 years . . . i.e., whether it is soon enough to do us any real good.

3. Shale gas is significantly worse than every other sort of energy except coal and oil. In the absence of a carbon price, cheap shale gas will tend to displace all energy sources, not just coal. Thus a realistic analysis of a Tea Partyesque policy of letting frackers "do their thing" with minimal regulation would compare shale gas to a basket of power sources that would be displaced, including hydro, geothermal, solar, wind, and nuclear, as well as discouraging investments in efficiency or decisions to conserve. Shale gas is unlikely to look good on this basis.

So, can shale gas be a "bridge fuel"? In my opinion, not in the way shale gas is happening right now. To have any hope of a real net benefit in terms of global warming this century, we need draconian limits on methane leakage and a carbon price (including both CO2 and methane) to ensure that shale gas replaces coal, not low-carbon energy sources or improvements in efficiency. The narrative of "the free market slashed CO2 emissions while the enviros weren't looking HAHAHA" has no basis in fact. The blind squirrel of the free market may stumble into an instance of profit-driven accidental mitigation once in a while (like the Russians controlling methane leakage from pipelines after the fall of the Soviet Union), but this ain't it. Similarly the idea that shale gas is an unambiguous "win" in mitigation terms, so much so that those questioning it are self-evidently trolls lurking under "the bridge to the clean energy future" is also not supported by the research.
Sea level rise to 2500. Source.

How we do shale gas is going to determine whether there is a window where there might be some net benefit. Both proponents and opponents of mitigation have tended to stress the 100-year time frame, for different reasons. If you accept that framing, even optimal shale gas substitution is probably going to show, at best, moderate benefits. If you are looking 500 years into the future, shale gas instead of coal is the best thing since sliced bread, but then, if you're looking 500 years into the future,  you can hardly help but realize that stopping all fossil fuel use as soon as possible should be our overarching priority.


Thursday, September 6, 2012

Half the Arctic sea ice is gone.

Source.
Lowest daily minimum for the 1980s (average):  7,312,906 km2
September 6, 2012: 3,614,219 km2

Still falling . . . I have no words for it.

Tuesday, January 3, 2012

Could there be a tipping point for the Arctic after all?


The rapid disappearance of the Arctic sea ice raised for many the prospect of a "tipping point" at which ice loss becomes irreversible and an ice-free North becomes a permanent condition.

Especially after the dramatic fall in 2007, efforts have been made to model the probable behavior of the rapidly waning sea ice. That led to an important paper with a simple method and an elegant result. Several scientists at the university of Washington did model runs in which CO2 forcing was gradually increased, looking for a tipping point ("threshold behavior"). They didn't find any. The sea ice disappeared gradually as conditions warmed. When they allowed conditions to cool, the sea ice came back. No tipping points in the model.

Well, brace yourselves for the shock, but "skeptics" missed the point of the paper, and shouted the results from every rooftop. Stupid scientists! "The Next Ice Age Now" crowed "More global warming propaganda debunked."

The actual result, rather than the result deniers fantasized had come about, was this: the dramatic fall in sea ice cover to date represents a steady response to the long-term climate warming. It is progressing fast because the climate is changing fast. The ice cover is still falling apart, not (so far) because of a tipping point, but because of rapid global warming. It could recover if we successfully halted or reversed global warming. Short of that, it will continue its death spiral.

Not really a pro-"skeptic" message, if you read past the headline. Fortunately for their peace of mind, they rarely do.

Work to understand the rapid changes to the Arctic continues. Chris R points us to this 2008 paper:

It is argued that deep atmospheric convection might occur during winter in ice-free high-latitude oceans, and that the surface radiative warming effects of the clouds and water vapor associated with this winter convection could keep high-latitude oceans ice-free through polar night. In such an ice-free high-latitude ocean the annual-mean SST would be much higher and the seasonal cycle would be dramatically reduced - making potential implications for equable climates manifest. The constraints that atmospheric heat transport, ocean heat transport, and CO2 concentration place on this mechanism are established. These ideas are investigated using the NCAR column model, which has state-of-the-art atmospheric physics parameterizations, high vertical resolution, a full seasonal cycle, a thermodynamic sea ice model, and a mixed layer ocean. Citation: Abbot, D. S., and E. Tziperman (2008), Sea ice, high-latitude convection, and equable climates, Geophys. Res. Lett., 35, L03702, doi:10.1029/ 2007GL032286.
It's not bathtub reading, but basically what Abbot and Tziperman set out to do was to explain evidence from the paleoclimate record of a warmer Arctic (1) and a less pronounced seasonal cycle at the poles. Both the late Cretaceous and the early Paleogene climate had these features, but existing climate models do not reproduce them well. When they created a more sophisticated model of the Arctic, they found it could settle into a stable ice-free state secondary to changes in cloud cover and atmospheric circulation (they discuss the same issues in a slightly earlier paper published by the Royal Meteorological Society.) The former has been cited 23 times; the latter 16, according to Google Scholar. So while this is serious science, the theory has not exactly caught fire. That they continue to explore the idea in Feb 2009 and again in July 2009, without a lot of other climate scientists taking up the charge,deepens the suspicion that Abbot/Tziperman have not convinced their colleagues that this is a thing, despite a 2011 paper (h/t Artful Dodger) which Abbot wrote with the great Raymond Pierrehumbert, which cites one of the 2009 papers as part of a broader discussion of possible sea ice tipping points.

On the other hand, it's not as if we have a lot of great explanations for the paleoclimate record laying around:
The consensus among these proxies suggests that Arctic temperatures were ∼19 °C warmer during the Pliocene than at present, while atmospheric CO2 concentrations were ∼390 ppmv. These elevated Arctic Pliocene temperatures result in a greatly reduced and asymmetrical latitudinal temperature gradient that is probably the result of increased poleward heat transport and decreased albedo. These results indicate that Arctic temperatures may be exceedingly sensitive to anthropogenic CO2 emissions.
The specter of an Arctic tipping point has not been laid to rest. If a similar amount of forcing to today's somehow got the Pilocene's Arctic 19C warming than today's, than some kind of hole in the floor seems a logical area of concern. (I wonder idly if the phlegmatic Dmitrenko ever modeled 19 degrees of warming over the East Siberian Arctic Shelf.)

UPDATE: Check out DosbatChris R's insanely good blog, for even more Arctic/Climate change goodness. Added to the blogroll, as well.

Sunday, December 25, 2011

Alaska methane levels spike

Let's hope the data at the far right (which is preliminary and unconfirmed) represents a measurement artifact and not the postscript to Ed Dlugokencky recent reassurances:
[B]ased on what we see in the atmosphere, there is no evidence of substantial increases in methane emissions from the Arctic in the past 20 years.
This came up at Neven's, whereupon it was pointed out that CO2 is spiking too:

Which could indicate the sensors are off. On the other hand, we would expect a significant fraction of any undersea methane release to be oxidized to CO2, and melting permafrost also releases both gases . . . so I don't know that the presence of a similar anomalous spike in the CO2 measurements really helps us decide if the methane spike is real. Only time will tell, I suppose . . . updates as I find them.

UPDATE:

Cold Bay shows a spike for CO2:

But nothing out of the ordinary for methane:

While NOAA's interactive map is incredibly helpful, what one would not give for a few Siberian sites.

Friday, December 23, 2011

Making sense of methane

I'm traveling today, but here are a few review articles about methane which are free online:

"Atmospheric Methane: Trends and Impacts"
"As discussed earlier, increasing water vapor from methane could be leading to an increased amount of polar stratospheric clouds. Ramanathan (1988) notes that both water and ice clouds, when formed at cold lower stratospheric temperatures, are extremely efficient in enhancing the atmospheric greenhouse effect. He also notes that there is a distinct possibility that large increases in future methane may lead to a surface warming that increases nonlinearly with the methane concentration."
"Archer: Destabilization of Methane Hydrates: A Risk Analysis"
"Methane is less concentrated than CO2, and its absorption bands less saturated, so a single molecule of additional methane has a larger impact on the radiation balance than a molecule of CO2, by about a factor of 24 [Wuebbles and Hayhoe, 2002]. The radiative impact of CH4 follows the concentration to roughly the 1/3 power, while the CO2 impact follows the log of the concentration. To get an idea of the scale, we note that a doubling of methane from present-day concentration would be equivalent to 60 ppm increase in CO2 from present-day, and 10 times present methane would be equivalent to about a doubling of CO2." 

"Strong atmospheric chemistry feedback to climate warming from Arctic methane emissions"
"The indirect contribution to RF of additional methane emission is particularly important. It is shown that if global methane emissions were to increase by factors of 2.5 and 5.2 above current emissions, the indirect contributions to RF would be about 250% and 400%, respectively, of the RF that can be attributed to directly emitted methane alone. Assuming several hypothetical scenarios of CH4 release associated with permafrost thaw, shallow marine hydrate degassing, and submarine landslides, we find a strong positive feedback on RF through atmospheric chemistry. In particular, the impact of CH4 is enhanced through increase of its lifetime, and of atmospheric abundances of ozone, stratospheric water vapor, and CO2 as a result of atmospheric chemical processes."

. . . so make sense of it your own damn self! Kidding. Here are a some things I gleaned:

* The East Siberian Arctic Shelf is uniquely vulnerable, and this vulnerable formation has its own vulnerable sub-sections. So a leak, while serious, would not necessarily imply a planetary disaster.

* Doubling methane would increase forcing by about 0.4 - 0.6 W/m^2 (that is a harder number to find then you might think.) The calculation is complicated, because the effect of methane on water vapor, ozone, and reactive O2 species effects both the warming caused by the methane and the lifespan of the methane in the atmosphere.

* The impact of an event similar to the Storegga landslide I found helpfully described as "similar in magnitude and duration but opposite in sign to a large volcanic eruption." The largest known "mud volcanoes" have similar potential.


Overall, this is a complex but not unapproachable subject. Worriers like me will find plenty to worry about, but there are also good reasons why oceanic methane release is not the thing keeping methane scientists up at night. And the science and research is really cool.

Thursday, December 22, 2011

Justin Gillis on methyl hydrates

Justin Gillis' dead eyes will burn into you until he gets to the truth.

Man, I should buy a lottery ticket.

While we were working our way through the very excited British accounts of the methyl hydrate threat, and the very phlegmatic (but not entirely convincing) response of Andy Revkin, Justin Gillis came out with a fantastic article on permafrost that is already getting rave reviews. And I thought "I wish Justin Gillis would take on this methane thing."

And in less than a day, Justin Gillis took on the methane thing: "Arctic Methane: Is Catastrophe Imminent?" And Gills' sources, like Revkin's are not overly impressed with the threat of massive methane release:


While examples can already be found of warmer ocean currents that are apparently destabilizing such deposits—for example, at this site off Spitsbergen, an island in the Svalbard archipelago in the Arctic—the scientists explained that a pervasive ocean warming sufficient to destabilize a lot of methane hydrates would almost certainly take thousands of years.
And even if that happened, many scientists say that the methane released would largely be consumed in the sea (by bacteria that specialize in eating methane) and would not reach the atmosphere. That is what seems to be happening off Svalbard.
“I think it’s just dead wrong to talk about ‘Arctic Armageddon,’ ” said William S. Reeburgh, an emeritus scientist at the University of California, Irvine, who spent decades studying such matters and says the likely consumption of methane within the ocean should not be underestimated. “Most of this methane is never going to see the atmosphere.”
Nobody regards the case as closed, and more research is necessary, but most of the methane deposits lining the margins of continents would seem to be fairly low on the list of scientific concerns about global warming.
 But the Arctic is, perhaps, something of an exception:

The methane hydrate deposits in the Arctic Ocean may represent a somewhat greater hazard because the Arctic is warming so rapidly. Considerable attention was devoted to a paper published last year that found methane bubbling out across large areas of ocean above the East Siberian Shelf, which has some of the Arctic’s largest methane hydrate deposits.
But that paper did not prove that the methane release was new, much less that it was increasing. Subsequent work by others has in fact suggested that these particular deposits have probably been unstable and slowly breaking down since the end of the last ice age, some 10,000 years ago.
Moreover, the zone from which the methane is escaping appears to represent only a fraction of the total methane beneath the Arctic Ocean. Most methane hydrate is far enough below the sea floor that sediments serve as an insulating layer, limiting how fast heat can spread downward. Again, the most careful calculations seem to put any significant methane release at hundreds or even thousands of years in the future.
As I hope to describe in more detail later this week, methane measurements in the atmosphere are consistent with the picture I just outlined. They do not support the idea that any big new releases of methane are occurring in the Arctic yet, at least not on a sufficient scale to have an overall impact on the planet’s methane burden. So if a methane “time bomb” actually exists in the ocean, as some news stories would have you believe, it seems fairly clear that it hasn’t gone off yet.
Still, there’s no question that some scientists are worried about this issue — less by what we know than what we don’t. Carolyn Ruppel, a geophysicist with the United States Geological Survey, is leading some of the efforts to get better information and especially to map areas off northern Alaska that may contain deposits of methane hydrate. “We need a baseline” against which future changes can be judged, she said.
None of these reassurances are entirely satisfying as regards the recent observations, but until we have some clear numbers on those observations and preferably confirmation from another team at the Shelf, or detect a change in the atmospheric burden of methane, it's hard to judge how, if at all, the new observations are going to change how we see the situation under the East Siberian Arctic Shelf.

We await developments (I do feel somewhat better). Meanwhile, a couple of good sources:


Neven's post and thread are superb, as usual.
The Columbia Journalism Review went over the major articles in this mini-methane-stampede.

Monday, December 19, 2011

Semiletov v Dmitrenko: The tale of the tape


Thanks to Mr. Revkin's intrepid reporting, we now know that there is a bit of a schism afflicting researchers looking at methane release from the East Siberian Arctic Shelf (ESAS). After reporting on the permafrost model presented by Dmitrenko at the recent AGU meeting (a model that suggests methane releases in the Arctic are not going to markedly accelerate with climate change), Revkin relates:
Semiletov is finally in touch with me (he'd gone on vacation right after AGU) and you'll hear more on his work soon. He's very critical of Dmitrenko. This kind of back-and-forthing is the process of science in action.
And indeed it is. And both of these authors have many peer-reviewed climate studies to their name. They are both respectable professionals, and only time will tell who has a better sense of what is happening on the ESAS. I was interested, though, in how they compared to one another in terms of their stature in this field, so I did a little research.

There is no completely reliable and objective way to gauge the impact of a particular researcher in their field, but a commonly used rule of thumb is to look at the number of times their publications have been cited. Once a scientist crosses the great divide of peer-reviewed publication that separates him or her from a Monckton or a Glenn Beck, the next test of relevance is whether or not their work is useful to others in the field; whether it is considered to be work that needs to be addressed or built upon. Science that doesn't stand the test of time gets superseded or just ignored.

Citations, then, are a way to assess, within the scientific community, what Samuel Johnson called the only objective measure of greatness "length and duration of esteem."

One quick example of how this works. Steig (2009) analyzed temperature trends in Antarctica. A "skeptic," Ryan O'Donnell, with assistance from Steig, turned his critique of Steig (2009) into something that successfully navigated peer review -- O'Donnell (2010). Climate Audit then triumphantly proclaimed "O'Donnell et al 2010 Refutes Steig et al 2009." Watts gloated similarly.

With both publications in print for more than a year, let's see how they're doing:

Improved methods for PCA-based reconstructions: case study using the Steig et al. 2009 Antarctic temperature reconstruction (O'Donnell et al, 2010). Cited by 2.
"Warming of the Antarctic ice-sheet surface since the 1957 International Geophysical Year" (Steig et al, 2009). Cited by 163.
 So that's basically how it works. Better science tends to get more citations. So with that in mind, I searched Google Scholar for "Semiletov and methane," and "Dimitrenko and methane," and took the first five articles I could find:

Dimitrenko and methane
IA Dmitrenko, SA Kirillov, LB Tremblay… - Journal of Geophysical …, 2011 - agu.org 

None yet.


IA Dmitrenko, SA Kirillov, LB Tremblay… - Journal of Geophysical …, 2010 - agu.org

Cited by 8.

…, JA Hoelemann, I Dmitrenko… - SPECIAL PAPERS- …, 2007 - books.google.com

Cited by 2.

C Schultz - Eos, Transactions American Geophysical Union, 2011 - agu.org

This is a summary of the first paper. I did it again! But there's nothing else to plug in here. No citations.

J Hoelemann, M Makhotin, C Wegner, I Dmitrenko… - 2008 - utsa.edu

None.

Dmitrenko has a total of ten citations for these papers. I felt a little bad about this, so I looked into the matter some more, and found, based on his publications listed at the International Arctic Research Center, that he is more of a water-and-wind guy, and less of a permafrost-and-methane guy (nothing wrong with that). So I tried again with the publications listed here:

Dmitrenko, I, Kirillov S, Eicken H, Markova N. 2005. Wind-driven summer surface hydrography of the eastern Siberian Shelf. Geophysical Research Letters. 32:L14613.

Cited by 13.

Dmitrenko, I, Holemann J, Kirillov S, Berezovskaya S, Ivanova D, Eicken H, Kassens H. 2006. Sea ice impact on the periodical shallow water dynamics in the Laptev Sea (Siberian Arctic). Proceedings of the 16th IAHR International Symposium on Ice at Dunedin, New Zealand. :375-381.

Cited by 2.

Dmitrenko, I, Kirillov S, Ivanov VV, Woodgate R. 2008. Mesoscale Atlantic water eddy off the Laptev Sea continental slope carries the signature of upstream interaction. Journal of Geophysical Research. 113:C07005.

Cited by 5.

Dmitrenko, I, Tyshko K, Kirillov S, Hƶlemann J, Eicken H, Kassens H. 2005. Impact of flaw polynas on the hydrography of the Laptev Sea. Global and Planetary Change. 48:9-27.

Could not find with Google Scholar.

Dmitrenko, I, Polyakov IV, Kirillov S, Timokhov L, Simmons HL, Ivanov VV, Walsh D. 2006. Seasonal Variability of Atlantic Water on the Continental Slope of the Laptev Sea during 2002-2004. Earth and Planetary Science Letters. 244:735-743.

Cited by 11.

A total of 31 citations, or an average of six per publication (possibly depressed a bit by my inability to find citations for the fourth paper.)

Semiletov and methane
SA Zimov, YV Voropaev, IP Semiletov, SP Davidov… - Science, 1997 - sciencemag.org 

Cited by 116. 

[PDF] from instrument.com.cnN Shakhova, I Semiletov, A Salyuk, V Yusupov… - Science, 2010 - sciencemag.org

Cited by 55.

N Shakhova, I Semiletov… - Geophysical Research Letters, 2005 - agu.org

Cited by 36.

…, I Semiletov - Journal of Marine Systems, 2007 - Elsevier

Cited by 19.

N Shakhova, I Semiletov, A Salyuk… - Geophysical Research …, 2008 - geobc.gov.bc.ca

Cited by 11.

Total citations: 227.


Semiletov's least cited paper is cited almost as many times (11) as Dmitrenko's most cited (13). He has more than seven times as many citations. Also, interestingly, he's clearly something of a specialist in this area; finding five papers about Arctic methane by Semiletov was no trouble at all. Dmitrenko has expertise in the relevant fields of hydrology and the Arctic, but he seems to be something of a methane newbie; only the first paper, which Revkin references, from October 2011, is about methane emissions.

Dmitrenko is a serious scientist; his work should be and will be judged on its merits. Nothing against him. But taking a quick look at their respective records, Dmitrenko is a strange choice for a debunker of Semiletov's concerns. First, basic weight-class stuff:

1. Dmitrenko's top papers have been cited a few dozen times; Semiletov has hundreds of citations.

On methane:

2. Semiletov has been studying methane emissions from waterlogged permafrost for at least 15 years; Dmitrenko published his first paper on the subject three months ago.

On the type of studies:

3. Dmitrenko's is a permafrost modelling study; Semiletov recently returned with direct observations from the ESAS.

Final verdict: ADVANTAGE SEMILETOV for greater experience, and longer record, more respect from peers, and recent direct observations of the phenomenon in question. I award bonus points because the established methane researcher, with a longer record and more citations, would be the one we would expect would be downplaying recent changes and be disposed to assert continuity in the face of excitable newcomers to the field. If the old man is worried, well, it puts me in mind of the old joke shirt:


Saturday, December 17, 2011

NYTimes: As Permafrost Thaws, Scientists Study the Risks


The Times hit it out of the park with this one. They covered the major points of the science, sketched how our understanding has changed, and provided real numbers for the estimated impact:

For now, scientists have many more questions than answers. Preliminary computer analyses, made only recently, suggest that the Arctic and sub-Arctic regions could eventually become an annual source of carbon equal to 15 percent or so of today’s yearly emissions from human activities.

But those calculations were deliberately cautious. A recent survey drew on the expertise of 41 permafrost scientists to offer more informal projections. They estimated that if human fossil-fuel burning remained high and the planet warmed sharply, the gases from permafrost could eventually equal 35 percent of today’s annual human emissions.

The experts also said that if humanity began getting its own emissions under control soon, the greenhouse gases emerging from permafrost could be kept to a much lower level, perhaps equivalent to 10 percent of today’s human emissions.
It sounds like a little thing, but I can't tell you how main mainstream news stories:

1) Avoid using numbers completely.
2) Take the first number they are told and put it in the article, not caring whether the number means anything (here they convert it to a % of human emissions, perfect).
3) Stick to one central number, assuming people will be hopelessly confused by the reality of different estimates.

The author gets to the point of what the numbers mean, too:

Even at the low end, these numbers mean that the long-running international negotiations over greenhouse gases are likely to become more difficult, with less room for countries to continue burning large amounts of fossil fuels. 
The whole article does a great job. Good numbers with appropriate caveats:

Scientists need better inventories of the ancient carbon. The best estimate so far was published in 2009 by a Canadian scientist, Charles Tarnocai, and some colleagues. They calculated that there was about 1.7 trillion tons of carbon in soils of the northern regions, about 88 percent of it locked in permafrost. That is about two and a half times the amount of carbon in the atmosphere. 
Followed by context:
Philippe Ciais, a leading French scientist, wrote at the time that he was “stunned” by the estimate, a large upward revision from previous calculations.
“If, in a warmer world, bacteria decompose organic soil matter faster, releasing carbon dioxide,” Dr. Ciais wrote, “this will set up a positive feedback loop, speeding up global warming.”

 It may be small of me, but I like a little action in my science stories. It reminds us of the absurdity of the denialist portrait of the rent-seeking elitist ivory-tower scientist, running computer simulations from a desk and collecting grant money:

One recent day, in 11-degree weather, Dr. Walter Anthony and an assistant, Amy Strohm, dragged equipment onto two frozen thermokarst lakes near Fairbanks. The fall had been unusually warm and the ice was thin, emitting thunderous cracks — but it held. In spots, methane bubbled so vigorously it had prevented the water from freezing. Dr. Walter Anthony, six months pregnant, bent over one plume to retrieve samples.

“This is thinner ice than we like,” she said. “Don’t tell my mother-in-law! My own mother doesn’t know.”
Well, they know now. And it's for the good of the public; they need to know what scientists really do.

They don't shy away from explaining how unusual these emissions are:
Dr. Walter Anthony had already run chemical tests on the methane from one of the lakes, dating the carbon molecules within the gas to 30,000 years ago. She has found carbon that old emerging at numerous spots around Fairbanks, and carbon as old as 43,000 years emerging from lakes in Siberia.
“These grasses were food for mammoths during the end of the last ice age,” Dr. Walter Anthony said. “It was in the freezer for 30,000 to 40,000 years, and now the freezer door is open.”

And they talk about the danger of fire:
One day in 2007, on the plain in northern Alaska, a lightning strike set the tundra on fire.
Historically, tundra, a landscape of lichens, mosses and delicate plants, was too damp to burn. But the climate in the area is warming and drying, and fires in both the tundra and forest regions of Alaska are increasing.
The Anaktuvuk River fire burned about 400 square miles of tundra, and work on lake sediments showed that no fire of that scale had occurred in the region in at least 5,000 years.
Are they going to leave it there? No, they are going to give you context for the effect of this fire:
Scientists have calculated that the fire and its aftermath sent a huge pulse of carbon into the air — as much as would be emitted in two years by a city the size of Miami.
As well as what the fire means in the broader context of the permafrost:
Scientists say the fire thawed the upper layer of permafrost and set off what they fear will be permanent shifts in the landscape.
Up to now, the Arctic has been absorbing carbon, on balance, and was once expected to keep doing so throughout this century. But recent analyses suggest that the permafrost thaw could turn the Arctic into a net source of carbon, possibly within a decade or two, and those studies did not account for fire.
“I maintain that the fastest way you’re going to lose permafrost and release permafrost carbon to the atmosphere is increasing fire frequency,” said Michelle C. Mack, a University of Florida scientist who is studying the Anaktuvuk fire. “It’s a rapid and catastrophic way you could completely change everything.”

Almost everyone agrees that the legacy media in general and science journalism in particular are on the rocks these days, but Justin Gillis seems not to have gotten the memo. This article is going to win some awards.

Tuesday, December 13, 2011

Remember that clathrate gun? Huge methane plumes found in the Arctic


In September Steve Bloom gave us a pointer to this:

Something strange


Commercial shipping through the Northeast Passage over the last couple weeks has reported the seas bubbling as if they were boiling.  Their observations have been reported to the science ministry who have sent scientists to investigate.

The story hasn't gone away and hasn't gotten any more reassuring:

Igor Semiletov, of the Far Eastern branch of the Russian Academy of Sciences, said that he has never before witnessed the scale and force of the methane being released from beneath the Arctic seabed.
"Earlier we found torch-like structures like this but they were only tens of metres in diameter. This is the first time that we've found continuous, powerful and impressive seeping structures, more than 1,000 metres in diameter. It's amazing," Dr Semiletov said. "I was most impressed by the sheer scale and high density of the plumes. Over a relatively small area we found more than 100, but over a wider area there should be thousands of them."
 For further context, see here.


See also here:
The East Siberian Arctic Shelf is a methane-rich area that encompasses more than 2 million square kilometers of seafloor in the Arctic Ocean. It is more than three times as large as the nearby Siberian wetlands, which have been considered the primary Northern Hemisphere source of atmospheric methane. Shakhova's research results show that the East Siberian Arctic Shelf is already a significant methane source, releasing 7 teragrams of methane yearly, which is as much as is emitted from the rest of the ocean.
This is one of those things; one of those things that was not supposed to happen. Or not happen for a long time. Or happen very slowly. To have methane boiling out of the Arctic sea, unoxidized, in plumes a kilometer across, in volumes sufficient to raise the local atmospheric levels of methane by a factor of a hundred . . . these are hard and heavy tidings. Hard to know what they mean, exactly, but nothing good.


Wednesday, October 26, 2011

Skeptical Science on permafrost melting


SkS has a post up on the decay of permafrost. Catnip to me, of course. It's a good summary, and highlights a number of issues. Here's one I hadn't thought about much:
Commercial activities in the Arctic are large, important to national economies and for the viability of local population centres.  Monitoring of permafrost melting and associated greenhouse gas emissions is undertaken by ground instruments and satellites.  However, unless technology able to replace melting permafrost with an affordable, durable load bearing foundation can be applied, it should be accepted that virtually all existing buildings and structures located on permafrost with foundations less than 5 metres deep are likely to be damaged or destroyed before 2100.
That's the homes and businesses of millions of people; oil, gas, and mining infrastructure, utilities and transport infrastructure, etc. The rapid erosion of the Arctic's 100,000km coastline (which is made of little rocks glued together with the aforementioned permafrost) also gets a good treatment.

They don't precisely estimate the amount of feedback from carbon (methane and carbon dioxide) released by melting permafrost. I don't know the answer either, although I discuss some estimates here and here. If you said 25-100ppm of CO2 in additional carbon by 2200, I don't think anyone could tell you you were wrong. If I find a better estimate, I'll post on it.

Permafrost FAQ

1. Why do we never hear about Antarctic permafrost?

Because for complicated reasons it doesn't store very much carbon (touch wood!) Since there are few people there, no one really cares.

2. I'm sick of reading wildly different estimates of the potency of methane as a greenhouse gas compared to CO2. What's the real number?

A molecule of methane traps heat hundreds of times better than a molecule of CO2. But it decays much faster. The really high estimates you see are molecule-to-molecule comparisons; the lower ones are long-term comparisons. The long-term comparisons turn out to be tricky. Methane is worse than CO2; and when it decays it turn into CO2, so it's really a lose-lose proposition.

3. Does melting permafrost release CO2 or methane?

Either CO2 or both. The methane makes headlines but the research I highlighted here suggests the CO2 is actually the bigger problem. More on methane here.


4. Can we stop the melting of the permafrost?

Probably not, given the feedbacks that have already kicked in, and Arctic amplification which we see rapid warming of the North even with radical emissions reductions. Short of large-scale geoengineering, the permafrost is going to go. The additional warming will further accelerate global warming.

Wednesday, September 21, 2011

More methane madness


From "arctictransport":

Something strange


Commercial shipping through the Northeast Passage over the last couple weeks has reported the seas bubbling as if they were boiling.  Their observations have been reported to the science ministry who have sent scientists to investigate.
H/t Steve Bloom.

The image above is from "Strong atmospheric chemistry feedback to climate warming from Arctic methane emissions" (Isaksen et al 2011). Although it sounds specialized, the paper, which is available in full, answers a number of basic beginner's questions about methane release (I needed to look those up . . . for a friend. Or for you, the reader. Yeah, that's it. For you the reader.)

1. How much methane is in the atmosphere now?


"The atmospheric concentrations in 2005 correspond to an atmospheric burden of 4,900 Tg CH4 (1 Tg = 1012 g)."


2. How long does it reside in the atmosphere?


"Atmospheric CH4 has a global average atmospheric lifetime of approximately 8 to 10 years [Denman et al., 2007]."


3. Why so brief, compared to CO2?

"Atmospheric CH4 is removed through oxidation by the hydroxyl radical (OH), mainly in the troposphere: R1    CH4 + OH --> H2O + CH3"


4. What is its ultimate fate?


Mostly to decay to CO2 (and ozone). So the best case scenario when you lose a ton of methane into the atmosphere is that it quickly oxidizes into a ton of CO2. Which, since it hangs around a lot longer and is the stuff that got us into this mess, is not so great.

5. There are only so many the hydroxyl radicals (OH) in the atmosphere. What happens if you release a bunch of it all at once?

It hangs around longer -- much longer -- leading to the amplified warming effect that gives the paper its title.


6. How much methane is in methyl hydrate deposits, compared to the atmosphere?

"The most recent review of the numerous published estimates of the amount of methane sequestered in global gas hydrate deposits converges on a range of 3 to 40 × 1015 m3 of methane [Boswell and Collett, 2011], which converts to a range of ∼1,600 to 21,000 Pg C."

1Pg = 1,000 Tg. So the amount of methane in the deposits is estimated to be between 300 times as much and 42,000 times as much as the total amount of methane in the atmosphere today.

7. Fuck me.

If any significant fraction of it escaped into the atmosphere on a human timescale, yes, that would be the general idea.

8. Could that happen? Really?

"Shakhova et al. [2008] speculate that 50 Pg CH4 could be released abruptly at any time from gas hydrates associated with subsea permafrost. Although there is no basis for estimating the rate of such a release, this value is used as a worst case scenario for the numerical model studies."

 9. Do they think such a release is likely?


No. "Although the high‐emission scenarios are unlikely to occur, they are compatible with the current knowledge of the cumulative magnitude of CH4 that might be emitted from permafrost thawing and from CH4 hydrate destabilization."

10. But worse case?

It's hard to call this the worst case, since what they are postulating is the release of less than 1% of the total reserves. But for the estimate they chose as a plausible worst case, 50 Pg, the short-term effect would be a global increase in radiative forcing of about 4W/m^2 (although, confusingly, they say 50 Pg could be released in one year, and then they model it as released over thirty years, significantly blunting the effect.)


The effect would be similar to doubling CO2 concentrations overnight. Temperatures would immediately rise, probably by 1-2C, with further rises in the following decades, depending on just what the actual climate sensitivity turns out to be.


Final thoughts from Iksaksen:


Fossil fuel CO2 emissions have increased substantially over the last decade and is now 40% higher than in 1990 [Le Quéré et al., 2009; Myhre et al., 2009]. The continued increase in greenhouse gas emissions toward the end of this century has the potential to produce significant warming at high northern latitudes well beyond what has been observed during the last decades [Hansen et al., 2007; IPCC, 2007]. There is a possibility that the Arctic temperature increases could be followed by extensive permafrost thawing, with enhanced CH4 emission from thermokarst lakes [Walter et al., 2006], with later release of CH4 from gas hydrates that would eventually be affected by warming temperatures. Considering the large, nonlinear atmospheric chemistry feedbacks discussed here, future CH4 emissions from permafrost deposits could be a larger concern for climate warming than previously thought.


Saturday, September 10, 2011

Record arctic melt

The sea ice news of the past week has been stunning. We've hit new lows in sea ice volume, area, and extent. Neven is unbeatable on Arctic sea ice, and he cuts to the heart of the matter:
The incredible has happened. In the past week the 2011 melting season has started to surpass record year 2007. First, the good people from the Polar Science Center informed us of the fact that their PIOMAS model is showing a new sea ice volume record. A day later a new all-time low on the Cryosphere Today sea ice area graph was reached. And two days after that the same thing happened on the University of Bremen sea ice extent chart. . . . Four years ago, weather conditions that on average occur every 20 years or so, brought huge amounts of heat into the Arctic via air and water, flushed large amounts of ice through Fram and Nares Strait and - to top if off - compacted the ice pack so hard at the end of the melting season that the minimum extent was finally reached in the last week of September. Up until mid-July this year's melting season resembled that of 2007, but after that things fell apart on the atmospheric front. The heat had been brought in alright, but the flushing through Nares (which opened late) and Fram was slow, and in these last weeks of the season there isn't much compaction to speak of, as the winds are too fickle to stay in place for a prolonged period. Despite all this 2011 is right down there battling it out with 2007 on almost every graph. This is a sure sign that the ice is very weak and thin in large parts of the ice pack, which means that perfect weather conditions conducive to melting and compacting are no longer necessary to break records. The ice will melt out, regardless of what the weather does.
It's been known since Arrhenius' hand-calculated climate model that Arctic melting will be a positive feedback causing further warming, as highly reflective ice is replaced by highly absorptive water. But the number turns out to be difficult to calculate as distinct from the overall climate sensitivity implied by a given set of model runs. I personally have been looking for hard numbers on this for a while, and -- early Christmas present! -- "Estimating the global radiative impact of the sea ice–albedo feedback in the Arctic" from last month's Journal of Geophysical Research has my back:
A simple method for estimating the global radiative forcing caused by the sea ice–albedo feedback in the Arctic is presented. It is based on observations of cloud cover, sea ice concentration, and top-of-atmosphere broadband albedo. The method does not rely on any sort of climate model, making the assumptions and approximations clearly visible and understandable and allowing them to be easily changed. Results show that the globally and annually averaged radiative forcing caused by the observed loss of sea ice in the Arctic between 1979 and 2007 is approximately 0.1 W m−2; a complete removal of Arctic sea ice results in a forcing of about 0.7 W m−2, while a more realistic ice-free summer scenario (no ice for 1 month and decreased ice at all other times of the year) results in a forcing of about 0.3 W m−2, similar to present-day anthropogenic forcing caused by halocarbons. The potential for changes in cloud cover as a result of the changes in sea ice makes the evaluation of the actual forcing that may be realized quite uncertain since such changes could overwhelm the forcing caused by the sea ice loss itself, if the cloudiness increases in the summertime.
Losing that sea ice is going to cause a number of problems; especially by accelerating Greenland's melt and the release of permafrost carbon, both CO2 and methane. But the direct effect is pretty gobsmackingly awful. In the short term (decades) another 0.25C of warming -- which may not sound like much, but which represents about a third of the warming seen so far and a fifth of the distance between here and 2C. The long-term effects -- 0.6 W m-2 -- mean an eventual warming of about 1.5C. Which means the process we've set in motion at the polls, which is likely irreversible on human timescales without geoengineering, is going to take us past +2C all by itself.

Tuesday, September 21, 2010

Open Mind calls it


I have to give a shout out to Tamino at Open Mind, who call the low point of Arctic ice within 1% of the true value. Amazing! He predicted 4.78 million km^2. The actual value was 4.81 million km^2.

Needless to say, he kicked denier butt on this one -- Anthony Watts and Steve Goddard, whose frequent posts on the state of the Arctic brightened our summer, missed the mark by 960,000 km^2 (High or low? Do you have to ask?)

Besides demonstrating yet again the value of recognizing the reality of global warming when making predictions about the physical world, what's notable about Tamino's eerile accurate prediction is that he generated it by plotting an exponential decline in the Arctic ice cover -- that is, in popular terms, a death spiral.

Monday, June 28, 2010

How it works

Steve Goddard has brought forth another one of his whistling-through-the-graveyard articles on the Arctic sea ice. And in a classic WUWT move, he offers the following two quotes:

From The New York Times, 1969

From the 9th century to the 13th century almost no ice was reported there. This was the period- of Norse colonization of’ Iceland and Greenland. Then, conditions worsened and the Norse colonies declined. After the Little Ice Age of 1650 to 1840 the ice began to vanish near Iceland and had almost disappeared when the trend re versed, disastrously crippling Icelandic fisheries last year.

From The New York Times, 2000

The thick ice that has for ages covered the Arctic Ocean at the pole has turned to water, recent visitors there reported yesterday. At least for the time being, an ice-free patch of ocean about a mile wide has opened at the very top of the world, something that has presumably never before been seen by humans and is more evidence that global warming may be real and already affecting climate. The last time scientists can be certain the pole was awash in water was more than 50 million years ago.

Is it possible that the IPCC is trying to rewrite the history books?


So, do these two news articles published thirty years apart contradict each other? (Not that that would be such an amazing thing if it were true.) As it turns out, no. Follow the quote back to the source and you find:

Col. Joseph O. Fletcher, a retired Air Force polar specialist now with the Rand Corporation in California, has cited the absence of pack ice around Iceland as an index of such trends.

From the 9th century to the 13th century almost no ice was reported there. This was the period- of Norse colonization of’ Iceland and Greenland. Then, conditions worsened and the Norse colonies declined. After the Little Ice Age of 1650 to 1840 the ice began to vanish near Iceland and had almost disappeared when the trend re versed, disastrously crippling Icelandic fisheries last year.


Steven implies that "there" is the Arctic, when "there" is actually "pack ice around Iceland." If this confusion is deliberate, he lied. If accidental, he's lazy and sloppy. As is so often the case with deniers, it's hard to tell which.