 |
| Nooooooo . . . |
Why oh why have surface temperatures slowed their relentless rise? I has an angst!

Well, for one thing, I've faced up to the fact that we, the concerned, have been enjoying having it both ways for quite a while. On the one hand, we've explained over and over that short-term variability in climate is the rule, not the exception; that knowing enough about the climate to see that action is needed is not the same thing as having an advance notice of the weather for the next hundred years; that the more different places and indicators you watch, and the longer you watch them, the more it becomes virtually a mathematical certainty that some of them will buck the overall trend. (And, lo, so it has come to pass . . .)
But on the other hand, in the last couple of decades virtually all of the short-term indicators pointed to dramatic global warming, and that's where it's easy to get lazy. Record fires! Record heat waves! Record ice loss! We were preaching, along with the real scientists, the no-drama gospel of long-term trends, but meanwhile, we had a good imitation of a Shakespearean tragedy running in the background, and it was hard not to make use of it.
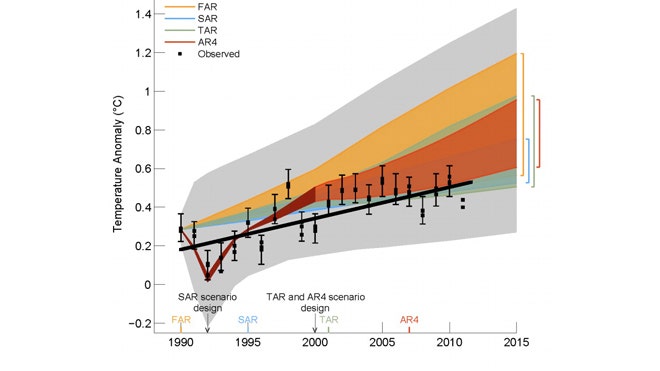
So, here were are. Where's the warming at? You can answer that one any number of ways, but the easiest one is with a single graph:

But this is mere poetry: Where have all the joules gone? It's a big, interesting question, one which has little to do with current debates over greenhouse gases emissions and a lot to do with our imperfect understanding of how energy sloshes around the system. Because we know it's around here somewhere. Maybe it's, I don't know, in the oceans somewhere:

In the larger sense, though, the explanation is less important than the persistent problem of over-emphasizing short-term trends. I wish I could say we should all stop doing that, so people will recognize our carefully measured assessments once the fog of the present moment has been lifted, but in truth I have no confidence that people have long enough memories for that. It may be the best we can hope for is not to fool ourselves.
isn't the current prediction calling for a neutral ENSO state this summer?
ReplyDeletehttp://www.cpc.ncep.noaa.gov/products/analysis_monitoring/enso_advisory/ensodisc.html
We shall have to see where we are next Christmas ;-)
DeleteGiven the persistent LN and the indestructibility of energy, I presume we are going to see a Very Big El Nino in the next year or two. It will be interesting to see if there's something of an upward step in GAT, as there was in the decade following the 1998 EN.
"isn't the current prediction calling for a neutral ENSO state this summer?"
DeleteYes, but if you look at the 3-month rolling average (-0.7), we could easily dip into La Nina briefly, even if it's on the way to neutrality. I don't know how to break out ENSO month by month, but let's say the last 2 months are -0.7. Even if April comes in at -0.1, the 3-month average would be -0.5 & we'd have a triple-dip.
Of course there's nothing rigorous about eyeballing it, but if you follow the link, you'll find that there is good evidence that the atmospheric warming slowdown has been accompanied by accelerated warming of the oceans, which is what La Nina is in a nutshell. Here's an argument specifically about the preponderance of La Nina and warming trends:
"Indeed, the current stand-still of the 5-year running mean global temperature may be largely a consequence of the fact that the first half of the past 10 years had predominately El Nino conditions, while the second half had predominately La Nina conditions (Nino index in Fig. 1). Comparing the global temperature at the time of the most recent three La Ninas(1999-2000, 2008, and 2011-2012), it is apparent that global temperature has continued to rise between recent years of comparable tropical temperature, indeed, at a rate of warming similar to that of the previous three decades. We conclude that background global warming is continuing, consistent with the known planetary energy imbalance, even though it is likely that the slowdown in climate forcing growth rate contributed to the recent apparent standstill in global temperature."
http://www.nasa.gov/pdf/719139main_2012_GISTEMP_summary.pdf
Not going to pretend I understand all of the science, but fascinating blog. Great to see there are still free thinkers out there. Good job!
ReplyDelete