Showing posts with label ENSO. Show all posts

Monday, July 6, 2015

Anybody notice NOAA has disappeared El Nino?

A couple of months ago, NOAA had declared a long-awaited El Nino event, after an unprecedented 54-month Nino-less period with two declared La Ninas and multiple abortive flirtations with El Nino status.

Their longstanding requirements for El Nino require at least five consecutive three-month averages at or above +0.5C. The new El Nino, as we've seen, inspired some commentators to literally incoherent levels of excitement:

Eric Holthas' unstoppable global juggernaught looked like this in the NOAA data:

And if you're thinking that looks pretty tame compared to the other El Ninos since 2003, you're right. In fact, those months were so marginal that they have now slipped out of El Nino status altogether. A few weeks ago NOAA made a quiet adjustment to its January-Febuary-March numbers, downward by 0.1C. This had the somewhat starting result of disappearing El Nino from NOAA's data:
Instead of a El Nino entering its eighth month, we now have two 3-month averages on either side of a Nino-spoiling 0.4C January-Febuary-March.

This means that when NOAA re-welcomes El Nino in a couple months, we will have had gap of 58 months, just a hair under 5 years, between El Nino events. Whereas the prior record was just 52 months (1959-1963, if you're curious.)

There is no serious point to this, other than the fact that scientists reassess and adjust data sets all the time, as better information becomes available. It's not the mark of a grand conspiracy to control a narrative, just researchers going about their business -- so routinely that a change like this can go almost unnoticed.

Friday, September 12, 2014

It's official: ENSO is fucking with us

We are now in the longest Nino-less period since NOAA record-keeping started:

Source
The last three-month period classified as El Nino was March-April-May of 2010. 51 months have passed since then (with more likely in the pipeline, given a 0.0 anomaly now.) This chart only goes back to 2002, but the full record shows what an anomaly this is. Fifty month gaps occur in 1959-1963 and again in 1978-1982. The present 51 months is longer than either.

So, how is this significant? Most simply, recent temperature trends are likely to under-estimate the long-term trends, unless a suppressed El Nino is a long-term consequence of AGW. That's possible, but most climate models predict El Nino will become more frequent and strong in a warmer world, rather than the converse.


Thursday, August 9, 2012

The New Normal -- Literally


We have arrived at an interesting place. ENSO and the solar cycle are the two major short-term influences on global temperatures (absent a major volcanic eruption.) They are now both as neutral as neutral can be:


Zero point zero. ENSO is balancing on the head of a pin. Now the solar cycle:


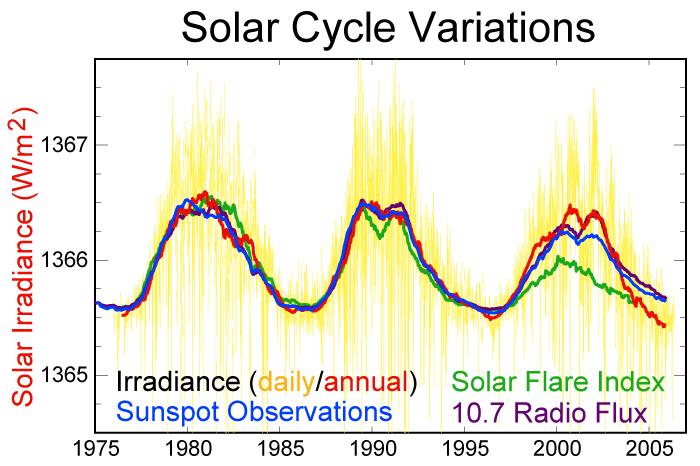
Looking at the smoothed values, the peak of the last solar cycle hit about 190, and the trough was at about 70. The average is (190 + 70)/2 = 130. And where is the blue line now? Right about 130.

Temperatures are as normal as they are gonna get. Shall we take a peek out into the world and see how the new normal is treating it?

Greenland still looks bizarre:

It's no longer melting over 96% of its surface . . . that's a comfort. But it's hard to look at these albedo numbers and think that all is well. This is some disturbing shit. A difference of 5% in the albedo compared to the average? That's a lot of joules . . . right where we don't want them.

Looking northwards, Dr. Jennifer Francis has a great presentation on how the changes in the Arctic are changing our weather. Key slide here:


And speaking of extremes, the contineintal US had its hottest July ever, and more importantly, drought and heat in the US have sent food prices skyward:

In July, food prices jumped 6%, after three months of declines, according to the United Nations' monthly Food Price Index released Thursday. The main drivers behind the increase? Grain prices. And more specifically, corn prices, which have hit record highs in recent weeks.
According to the U.N. report, global corn prices surged nearly 23% in July, exacerbated by "the severe deterioration of maize crop prospects in the United States, following drought conditions and excessive heat during critical stages of the crop development."
Since we so recently learned that big thunderstorms can chew up the ozone layer over North America, perhaps we should check on thunderstorms in our new world:


 Note that the graph ends in 2011. The crazy thunderstorms that have wracked the Midwest and Northeast over the last two months don't show up yet.

Torn to pieces by an Arctic cyclone, the thin sea ice up north is rapidly giving up the ghost.


Both the cyclone, and the thinness of the ice that got walloped, were fueled by Arctic warming and accelerate it further.

In the upper left you can see a huge chunk of the ice sheet break off and go its own way. This is not, to say the least, a common occurrence, and the ice sages at Neven's seem to be in agreement that this has never been seen before in thirty years of satellite observations.

Both solar activity and the ENSO index are still rising. Be interesting what the world looks like in an extra-warm year, won't it?

Monday, February 27, 2012

La Nina fading faster


The sharp turn for the warmer in the Pacific is continuing. Last week we saw a dramatic difference between the resurrected La Nina at the beginning of the year:


Versus last week:


And finally today's update:

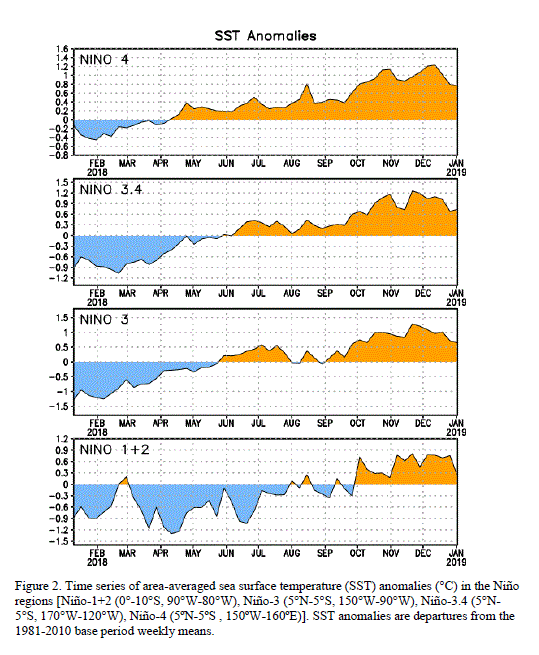
Zones 3 and 1 + 2 are in positive territory; 3.4 (where the official ENSO index is measured) is still negative, but only just. The anomaly, at -0.4C, puts us back in ENSO neutral territory. This calls to mind what I said when it looked like we were headed for a double-dip La Nina:

If you ask the question of how many times the same phase repeated after making it all the way back to baseline (reaching or crossing 0.0C from either direction), and didn't have a weak alternate-phase episode that missed counting as such because it was not quite long enough or not quite intense enough, and then went back into the same phase, the answer is: it's only happened twice in sixty years, out of thirty-five transitions. So what they're projecting will happen would be pretty atypical.

. . . [But] while another La Nina episode is forecast, it hasn't happened yet. If it turns out to be too weak to meet the five-seasons cutoff, then goes into an El Nino, then there will have been nothing odd about it at all.
Right now there have been three overlapping three-month rolling averages that show La Nina conditions (3.4 anomaly < -0.5C):

 We have 2 months to go to meet the definition of a double-dip: December-January-February, and January-February-March. I doubt the former will shoot above -0.5C; it's already the end of February, and we will have had maybe a week or two total (in three months) above that mark. January-February-March, then, is ground zero for whether we end up with back-to-back La Ninas, or the oscillation gets another chance to live up to its name.

Wednesday, February 22, 2012

La Nina whiplash fading fast

The mini-me La Nina has taken a dramatic swing for the warmer. This was the picture at the end of January:

You can see the brief flirtation with ENSO neutrality before the Pacific's evident determination to resume La Nina bigger and badder and colder than before. What a difference three weeks makes:
The weather-masters now think we could enter the ENSO neutral zone as soon as March. With solar activity still headed upwards, we could be in for a hot summer.

Tuesday, January 3, 2012

ENSO and public concern over climate change

Hypothesis: Americans are not very bright.

Hence we predict their level of concern about global warming will vary quite a bit with the short-term flucuations in warming, despite the strong, persistent long-term trend.

The most important driver of temperature variability, in the short term, in ENSO (El Ninos and La Ninas):


A similar but less powerful short-term influence is the phase of the solar cycle:


So giving people a year or two to process news stories about temperature records, extreme weather, ice cover losses and the like, we might expect to see the levels of concern rising in 1999-2000 after the big El Nino, with a rise starting in 2004-2005 related to the second large recent El Nino, with concern falling in 2009-2010, related to a La Nina event.

The phase of the solar cycle would make the peak in concern from 1998-2002 slightly higher, while the lower solar activity after that, as well as the lack of a similarly intense El Nino event, could be expected to make the peaks of concern lower, and the troughs deeper. In late 2011 we saw the next solar cycle finally start to wake up, but this will not have had a big impact yet.

So how did we do? Here's the gallup polling on concern for global warming:

Not bad. We don't see the brief 2009 El Nino in the data, but it may be too early (the polling stops in May 2011), or it may be the rapid return to La Nina conditions blunted the effect.

Of course, this is all fun and games with graphs, and if we were attaching any seriousness to it it would come dangerously close to mathdurbation. It's just as easy to come up with a different correlation, for example:

Hypothesis: Americans care about global warming only when they are not much more worried about the economy:


 When people felt relatively better, in 2008, concern about global warming was high. When economic worry spiked in 2009, concern about global warming fell. The slight increase in economic confidence recently may show up in 2012's climate polling, especially if the economy continues its still painful slow but accelerating recovery.

Should we expect these short-term reactions to subside as the long-term warming continues to push the earth's climate further out of the Holocene range? Unfortunately, we cannot assume that. Gradual changes and shifts over time are difficult to perceive. This is often described via the (apocryphal) anecdote of the frog placed in lukewarm water that is slowly boiled alive. People rapidly normalize their present experiences, unless there is a readily identifiable shift. The gradual erosion of my paycheck by inflation is not as striking as being swindled out of some portion of my savings, even if they cost me the same amount of money. That is one reason we as a society are prepared to invest huge amounts in speculative measures to reduce tiny risks (dying in a terrorist attack, for example) but not, as yet, to invest significant amounts of money, time, or even attention to the overwhelming likelihood of the less vividly imagined but far more globally destructive process of climate change.


Wednesday, December 14, 2011

Solar forcing headed up, La Nina hanging in

Just as we would expect at this point in the cycle:


The last month to put up numbers like November was eight years ago.

We continue to languish in what will apparently end up being a double-dip La Nina:

But the odds continue to favor at least one good El Nino coinciding with the upper half of the solar cycle, in the next four years or so. That will be a hot year.


Friday, September 23, 2011

La Nina forecast to reemerge. Again?

No sooner had we bid farewell to La Nina, with two three-month averages pegging in at 0.0C anomaly, than we started the current abrupt turn back to La Nina conditions in the Pacific. NOAA seems pretty confident now about where this is going:

La Niña conditions have returned and are expected to gradually strengthen and continue into the Northern Hemisphere winter 2011-12.
Usually the El Niño-Southern Oscillation (ENSO to its friends) alternates between warm and cool phases. We got a pretty stiff shot of La Nina; we would normally expect El Nino, the warm phase, to be next on our agenda. So how atypical is it for the oscillation to return to baseline and then oscillate right back into the same phase?

It's fairly atypical, but not unheard of.

I hope you can read that, if not, check out a larger color-coded chart in the NOAA's weekly ENSO update. But here's the gist: when using NOAA's definition of an episode strictly, 24 episodes are followed by the opposite phase, while seven (22.5%) are followed by another episode of the same phase. One chance in five: somewhat unusual, but not rare.

However, if you loosen the definition of an event a little bit, our current circumstances look more atypical than that.

This is the strict definition used by NOAA:

Historical Pacific warm (red) and cold (blue) episodes based on a threshold of +/- 0.5 oC for the Oceanic Nino Index (ONI) [3 month running mean of ERSST.v3b SST anomalies in the Nino 3.4 region (5N-5S, 120-170W)], calculated with respect to the 1971-2000 base period. For historical purposes El Niño and La Niña episodes are defined when the threshold is met for a minimum of 5 consecutive over-lapping seasons.

If you scan the chart, you find two La Nina-ish episodes that just missed the overlapping season cutoff:

1981 from January: -0.3, -0.5, -0.5, -0.4, -0.3, -0.3, -0.4, -0.4, -0.3
2005 from October: -0.4, -0.7, -0.7, -0.6, -0.4

If we count those, we lose two double-Ninos and add four opposite-phase transitions.

We can perform a similar trick with events that counted double after briefly losing their mojo before strengthening again:

1969 from May: 0.7, 0.6, 0.5, 0.4, 0.4, 0.6, 0.7, 0.8
2000 from April: -0.6, -0.5, -0.4, -0.4, -0.4, -0.5, -0.6

Both of those count as back-to-backs because of their brief flirtation with 0.4/-0.4. But the current conditions got to 0.0:

2011: -0.6, -0.2,  0.0,  0.0

If you ask the question of how many times the same phase repeated after making it all the way back to baseline (reaching or crossing 0.0C from either direction), and didn't have a weak alternate-phase episode that missed counting as such because it was not quite long enough or not quite intense enough, and then went back into the same phase, the answer is: it's only happened twice in sixty years, out of thirty-five transitions. So what they're projecting will happen would be pretty atypical.

Two caveats: when we mess around with the definitions in looking at a particular present-day event, we are flirting with the Texas Sharpshooters Fallacy. So except for the entertainment value, we should probably stick with the estimate that this happens about one time in five. Also, while another La Nina episode is forecast, it hasn't happened yet. If it turns out to be too weak to meet the five-seasons cutoff, then goes into an El Nino, then there will have been nothing odd about it at all