When Intrade offers an ENSO-adjusted version of that trade . . . let me know.
Over on WUWT, the zombies overwhelming chose this meme to help them to cope with March's record-breaking warmth. In the first ten comments on "March UAH Global Temperature Update" no fewer than seven mention El Nino, for example:
Ho hum.
The El Nino is pumping energy into the troposphere whilst the low level of solar activity causes the atmosphere to contract which slows down energy loss to space.
A purely temporary combination and nothing to do with CO2.
Of course, the fact that the current El Nino affects temperatures globally is not a myth. Is it responsible for the record-breaking warmth? Here the story gets slightly more complex. The response I gave to the poster above is still valid:
We've had many El Nino years -- this one is nothing special. Why, in the absence of global warming, should this year be the warmest in 130 years, warmer than any of the last ten El Ninos? At best, there's a 9% chance of that. Yet, Intrade's odds on the hottest year ever are at 60%. Funny, that.
But I think it's also useful to consider the general problem of long-term warming, records, and short-term trends. Are records the best way to measure the progress of global warming? No, they are not. Precisely because they are affected by many sources of short-term variability, records tell you little about trends, and they occur unpredictably. Better techniques are to look at long-term weighed averages, like these:
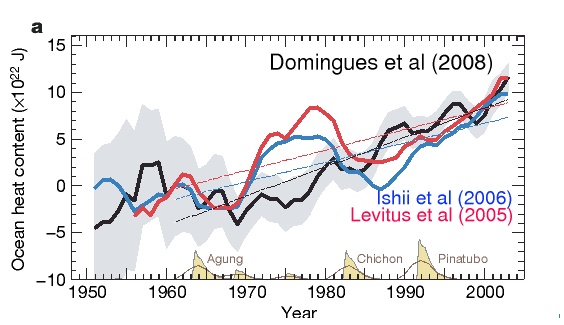
Note that even with the five-year weighed average, there are periods of cooling that temporarily interrupt the long-term warming trend. Another method of looking at global warming arguably superior to surface temperatures, is ocean heat content. Most of the earth's radiation imbalance goes into the oceans, and the trend is clear:
So why pay attention to records at all? Because although they are not the best way to gauge the progress of global warming, they are one way to show that it is happening, and show it in a way that is very easy to grasp for the layperson (a group in which I include myself).
Simply put, if months and years are repeatedly found to be hotter than any comparable period earlier in the record, and we rule out chance variation (as is easy to do in the case of warming temperatures, and I showed here) then we can be confident that temperatures are warming, on average.
So how does one respond to the allegation that short-term effects like ENSO are responsible for records falling? Superficially, the argument has a lot to recommend it. 2010 would not be looking like a record-breaker were we in a La Nina event. 2005 and 1998, prior record-holders, were both El Nino events. So the correlation is real. What's the causality?
Imagine a warming trend of 0.2 C per decade. This is superimposed on a short-term variability, whose magnitude we can guesstimate by looking at the month-to-month variability in the GISTEMP anomaly.
Let's look at the records for January in the 50s, for example:
1950: -24
1951: -32
1952: 15
1953: 15
1954: 23
1955: 27
1956: -18
1957: -10
1958: 41
1959: 8
The maximum variation from year to year is 0.73 C (+0.41 to -0.32). But those years are pretty far apart, and it's never a bad idea to eliminate outliers when you can. So let's take the next most extreme pair, +0.27C; -0.24 C. Those values are closer to their neighbors than our outliers. So we can estimate the short-term variability at about 0.5 C. The cause of that variability doesn't matter; for our purposes, it's just random noise.
Now, my hypothesis: Even with a strong warming trend, record-breaking months and years will overwhelmingly occur when the short-term random variation is positive. If this hypothesis is valid, then we cannot discount record warming because it occurs in an El Nino year or a year of high solar activity or what have you.
At first blush, that may seem counterintuitive. Suppose the 1998 El Nino represented a positive random value of 0.4C (out of a possible 0.5C). In two decades, global warming will have made up that 0.4C and will break the record without the help of El Nino. And so it will -- the 1998 record. The trouble is, over the course of those two decades, many more El Nino years will have occurred, and set new records. No matter how far you look into the future, years with short-term warming will always be the record-setters.
Consider the warmest year in the 50s; 1958, +0.41C. Without even looking it up, you could guess it was an El Nino year, as indeed it was: the 1958 El Nino peaked at 1.7, compared to the current one which peaked at 1.8. At the time, it was tied for the warmest January on record, a record it held until 1981. How does it compare to temperatures in the last 10 years?
2001: 48
2002: 83
2003: 77
2004: 60
2005: 87
2006: 58
2007: 108
2008: 38
2009: 67
2010: 88
Recall that the 50s record was 41. Nine out of ten of the last ten years beat the all-time warmest January from the 50s -- a record that stood until 1981.
But here's the key question -- how many of those were the all-time warmest January when they occurred? Only three of them: 2002 (83); 2005 (87), and; 2007 (108). Two out of the three (2005 and 2007) were El Nino months, and the third (2002) was neutral (but occured at the peak of the solar cycle, the other major short-term influence on surface temperatures).
To see why this is so, look at 1998 again. We said 1998 was +0.4 C on the 0-0.5C random variation scale. If every year that followed was +0.0 C, the record (assuming our +0.2C decadal trend) would fall in 21 years. But that's the thing about short-term variation -- it doesn't remain constant; it varies. At some point in that 21 year span, another +0.4 C year or +0.35 C year or +0.45 C year will happen, and because of the underlying warming, it will break the record and reset the clock on outrunning short-term variation.
No matter how much global warming we experience, the record-breaking years will also be the ones in which the short-term trends are positive too. Long-term warming + short-term warming will always be > long-term warming + short-term cooling. Warming will no more produce an all-time warmest year with a strong La Nina than a man can grow taller than the top of his hat. But short-term warming and cooling cycles that have been in place since records began should not suddenly cause record-breaking temperatures. Hence the near-continuous crash of temperature records to the ground does illustrate global warming -- and the fact that it occurs when short-term cycles are also positive is logically necessary, and changes nothing.
No comments:
Post a Comment